Blogging is still relevant in 2025. More than 20 billion people read blogs every month. As a result, 55% of marketers say blogging is one of the top marketing strategies to reach an audience.
Are you planning to start a blog for your business? Or planning to optimize your existing one? This article will help you in both cases.
In this article, you will get a complete insight into blogging statistics. I have compiled here all the essential statistics of blogging.
Let’s have a look at these statistics.
Blogging Statistics (Top Picks)
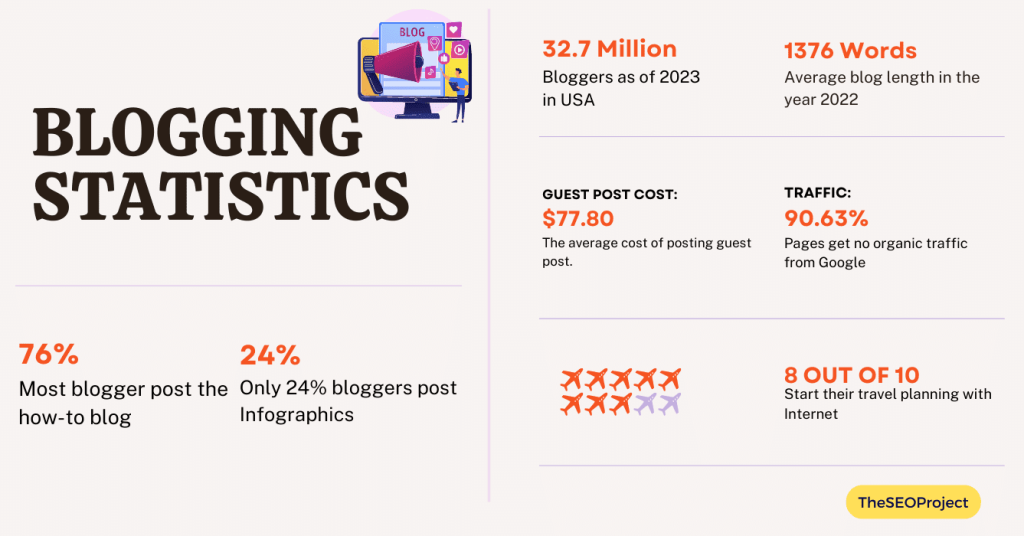
- Globally, there are more than 600 million blogs on the Internet.
- There are 32.7 million bloggers in the United States as of 2023.
- 76% of bloggers post the most how-to blogs, while 24% post infographics.
- 90.63% of pages get no organic traffic from Google.
- Only 32% of bloggers are checking their blog’s traffic analytics.
- The average cost of posting paid guest posts is around $77.80.
- 7% of Bloggers post guest posts on only one site, while 56% post on multiple sites.
- The average length of blogs was 1376 words in 2022, and it was just 808 in 2014.
- It took 4 hours and 10 mins to write a typical blog post in 2022. This time has increased by 74% from 2014.
- The bloggers who post 2 to 6 posts weekly get 42% of better results, and those who post monthly get only 16% of better results.
- 90% of bloggers drive traffic to their content through social media, and 12% do through paid services.
- More than 80% of travel planning starts with the Internet. And this trend is growing day by day.
- WordPress users generate 70 million new blogs and 77 million new monthly comments.
- 52% of bloggers said finding time to create and promote content is their biggest challenge in blogging.
Blogging Statistics (General)
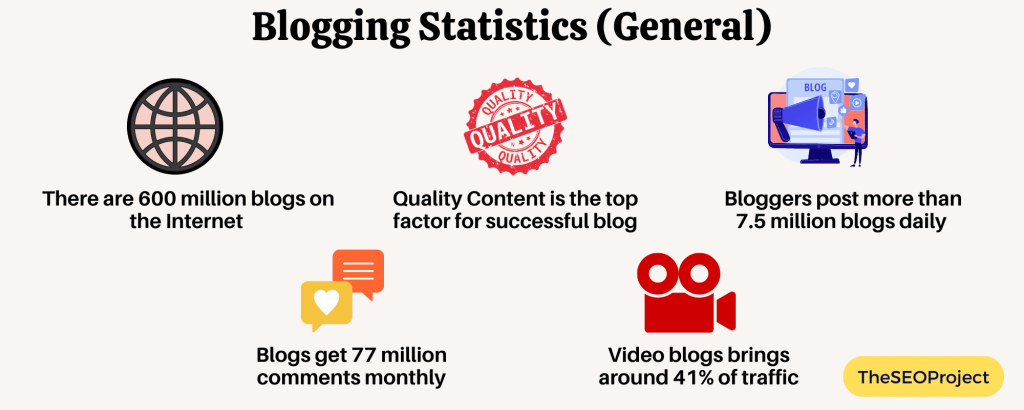
- Globally, there are more than 600 million blogs on the Internet.
- There are 32.7 million bloggers in the United States as of 2025.
A table shows the number of bloggers in the United States from 2014 to 2022.
| Year | Number of Bloggers |
| 2014 | 27.4 million |
| 2015 | 28.3 million |
| 2016 | 29.1 million |
| 2017 | 30 million |
| 2018 | 30.6 million |
| 2019 | 31.2 million |
| 2020 | 31.7 million |
| 2021 | 32.2 million |
| 2022 | 32.7 million |
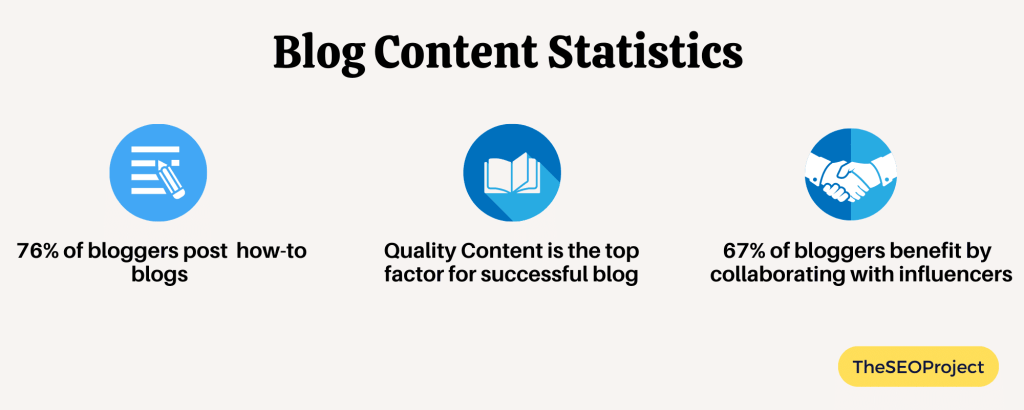
- Good quality content is the top factor for a successful blog. It was rated 8.8 out of 10.
A table shows the top factors for a successful blog (Rated 0 to 10).
| Top Factors | Ratings |
| Good Quality Content | 8.8 |
| Eye-catchy Headline and Introduction | 8.5 |
| Search Engine Optimization | 7.6 |
| Email Subscribers | 7.2 |
| Good Blog name and URL | 6.3 |
| Social Media Share and Follows | 6.0 |
- Video blogs produce a strong result, with 41%.
A table shows the top content formats that produce strong results.
| Content Format | Result |
| Video Blogs | 41% |
| Contributors Quotes | 34% |
| Audio | 33% |
| Lists and Statistics | 32% |
| Images | 30% |
- Bloggers post more than 7.5 million blogs daily.
A table shows the frequency of posting blogs on the Internet.
| Duration | Number of Blogs |
| Daily | 7.5 million |
| Weekly | 52.5 million |
| Monthly | 225 million |
| Yearly | 2737 million |
- When Orbit Media conducted the survey and asked questions to bloggers that does blogging work in 2022. Then, 80% of bloggers said blogging could drive results. The remaining findings of the survey are as follows:
| The answer of the blogger | Share of respondents |
| I do not know if the blog delivers value | 11% |
| The blog has disappointing results | 9% |
| The blogs have some results | 54% |
| The blogs have strong marketing results | 26% |
- 33% of people read blogs to learn something new, while 20% read for entertainment.
- Only 10% of people read blogs for industry news.
- 77% of internet users read blogs.
- Blogs get 77 million comments monthly.
- Only 32% of bloggers are checking their blog’s traffic analytics.
A table shows the frequency of checking analytics of blogs.
| Frequency | Share of Responmdenys |
| Always | 32% |
| Usually | 26% |
| Occasionally | 26% |
| Never/Rarely | 12% |
| I do not have access to analytics | 4% |
Source: Finance Online, Demandsage, Orbit Media, Ahref.
Blog Content Statistics
When it comes to blogs, content plays an important role. What kind of content you use for your blog decides your results.
In this section, we will see the top content types, which bloggers use the most, and some other statistics.
- 76% of bloggers post the most how-to blogs, and 24% post infographics.
A table shows the top content types that bloggers post the most.
| Content-Type | Share of Respondents |
| How-to article | 76% |
| Lists | 55% |
| Guides and ebooks (Long form) | 43% |
| News and Trends | 43% |
| Opinion | 38% |
| Interviews | 34% |
| Gated Content | 27% |
| Webinars | 25% |
| Infographics | 24% |
| Roundups | 22% |
- 35% of bloggers said Guides and ebooks are the most effective content type. They deliver strong results.
A table shows the most effective content that delivers the most strong result.
| Content-Type | Share of Respondents |
| Guides and ebooks | 35% |
| Gated Content | 35% |
| Infographics | 33% |
| Roundups | 32% |
| Interviews | 30% |
| Lists | 30% |
| Webinars | 29% |
| How-to articles | 28% |
| News and Trends | 25% |
| Opinion | 25% |
- 67% of bloggers said they always benefit from collaboration with influencers, but, 20% never benefit from it.
- 27% of bloggers sometimes benefit from collaboration with influencers, and 40% usually benefit from it.
- 73% of bloggers updated their content more often in 2022, and only 53% updated content in 2017.
A table shows the percentage of bloggers who update their content more often from 2017 to 2022.
| Year | Percentage of Bloggers |
| 2017 | 53% |
| 2018 | 62% |
| 2019 | 68% |
| 2020 | 70% |
| 2021 | 71% |
| 2022 | 73% |
- 23% of bloggers added a video to their content in 2022, and only 15% added it in 2014.
A table shows the percentage of bloggers who added a video to their content from 2014 to 2022.
| Year | Percentage of Bloggers |
| 2014 | 15% |
| 2015 | 12% |
| 2016 | 15% |
| 2017 | 16% |
| 2018 | 19% |
| 2019 | 26% |
| 2020 | 25% |
| 2021 | 24% |
| 2022 | 23% |
- 49% of bloggers who add 7 to 10 images to their content get a better result.
A table shows the percentage of bloggers who get better results based on visuals.
| Visuals | Bloggers who get better results from visuals |
| One image | 21% |
| 2 to 3 images | 21% |
| 4 to 6 images | 33% |
| 7 to 10 images | 49% |
| More than ten images | 44% |
| Videos | 38% |
Source: Orbit Media.
Blogging SEO Statistics
SEO is an essential aspect of blogging. 71% of bloggers believe that SEO is an important traffic source.
In this section, we will see some crucial statistics about blogging SEO.
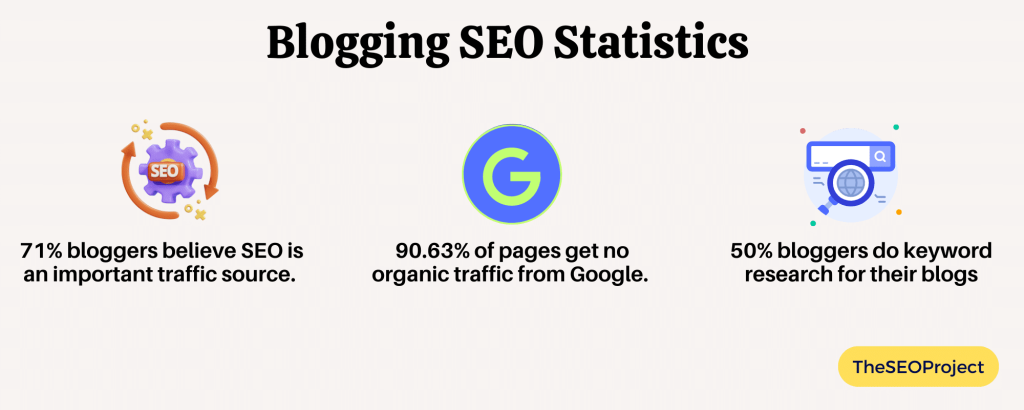
- 90.63% of pages get no organic traffic from Google.
A table shows organic search traffic from Google by visitors.
| Visits | Percentage of Pages |
| 0 Visits | 90.63% |
| 1 to 10 Visits | 5.29% |
| 11 to 100 Visits | 2.84% |
| 101 to 1,000 Visits | 1.04% |
| More than 1,001 Visits | 0.21% |
- Only 5.7% of pages rank in the top 10 positions within a year of publication.
- The average top 10 search pages are over two years old.
- Only 5 out of 10 bloggers do keyword research for their blogs.
- 17% of bloggers never search for keywords.
- 73% of bloggers often update their old content.
- 72% of marketers say quality content writing is the most effective SEO tactic.
Source: Ahref.
Guest Blogging Statistics
Guest blogging is essential for all businesses to drive traffic. Many bloggers often post guest blogs to get strong results.
In this section, I have gathered all the essential statistics about guest blogging statistics.
- The average cost of posting paid guest posts is around $77.80.
- 60% of bloggers post 1 to 5 guest posts monthly.
- 7% of Bloggers post guest posts on only one site, while 56% post on multiple sites.
A table shows the activities of guest post bloggers.
| Activity | Share of Respondents |
| I post for just one site | 7% |
| I post for multiple sites | 56% |
| I write the posts | 52% |
| I come up with the ideas | 87% |
| I do the outreach | 84% |
| I do the prospecting | 85% |
- 43% of B2B markets do guest posting.
Source: Ahref.
Blog Length, Frequency, and Time Statistics
Every small thing matters a lot for a successful blog.
I have compiled all the necessary statistics about blogs’ length, frequency, and posing time here. That may help you in your blogging.
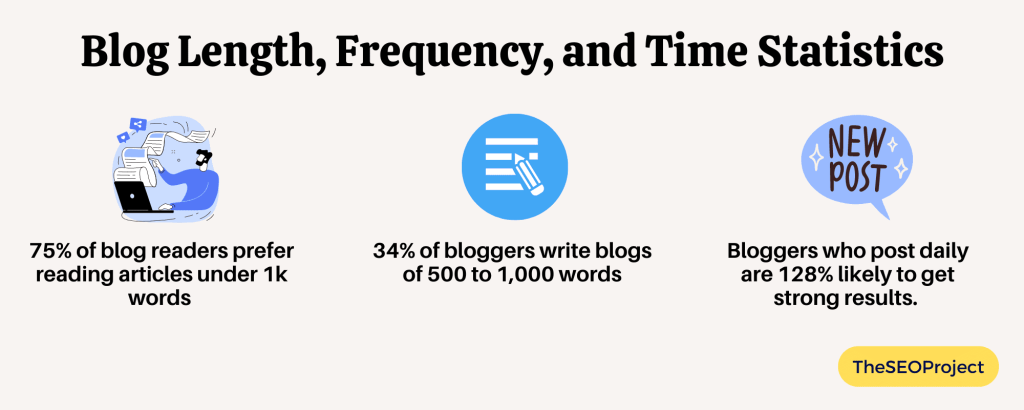
- 75% of blog readers prefer reading articles under 1,000 words.
- The average length of B2B blogs is 1,300 words, and B2C blogs are 1,460.
- The average length of blogs was 1376 words in 2022, and it was just 808 in 2014.
A table shows the average length of blogs from 2014 to 2022.
| Year | The Average Length of Blogs |
| 2014 | 808 words |
| 2015 | 887 words |
| 2016 | 1054 words |
| 2017 | 1142 words |
| 2018 | 1151 words |
| 2019 | 1236 words |
| 2020 | 1269 words |
| 2021 | 1416 words |
| 2022 | 1376 words |
- It took 4 hours and 10 mins to write a typical blog post in 2022. This time has increased by 74% from 2014.
A table shows the time to write a typical blog post from 2014 to 2022.
| Year | Time |
| 2014 | 2 hours and 24 minutes |
| 2015 | 2 hours and 35 minutes |
| 2016 | 3 hours and 16 minutes |
| 2017 | 3 hours and 20 minutes |
| 2018 | 3 hours and 28 minutes |
| 2019 | 3 hours and 57 minutes |
| 2020 | 3 hours and 55 minutes |
| 2021 | 4 hours and 1 minute |
| 2022 | 4 hours and 10 minutes |
- 34% of bloggers write blogs of 500 to 1,000 words.
A table shows the percentage of bloggers by word of blogs.
| Words | Percentage of Bloggers |
| Less than 500 words | 5% |
| 500 to 1,000 words | 34% |
| 1,000 to 1,500 words | 31% |
| 1,500 to 2,000 words | 19% |
| 2,000 to 3,000 words | 8% |
| More than 3,000 words | 4% |
- Only 2% of bloggers post blogs daily, while 24% post weekly.
A table shows the frequency of posting blogs.
| Frequency of Posting Blogs | Share of Respondents |
| Daily | 2% |
| 2 to 6 posts per week | 12% |
| Weekly | 24% |
| Several Per Month | 24% |
| Monthly | 18% |
| Less Than Month | 6% |
| Irregular Intervals | 14% |
- The bloggers who post 2 to 6 posts weekly get 42% of better results, while those who post monthly get only 16% of better results.
A table shows the results of bloggers who post more frequently.
| Frequency of Posting Blogs | Get Results |
| 2 to 6 posts per week | 42% |
| Weekly | 29% |
| Several Per Month | 27% |
| Monthly | 16% |
| Less than Monthly | 14% |
| At Irregular Intervals | 17% |
- The best time to post your blog is 7:00 A.M. because people read the blog posts the most between 7:00 A.M. to 10:00 A.M.
- Tuesday is the best day to post a blog, followed by Thursday and Monday.
- Bloggers who post regularly are 128% more likely to get strong results.
- Posting a blog four times a week can drive traffic 3.5 times more than posting just once a week.
Source: Orbit Media, Ojdigitalsolution.com.
Blog Traffic Statistics
For any blogger, driving traffic to get strong results is essential.
I have compiled all the critical statistics about blog traffic in this section.
- 90% of bloggers drive traffic to their content through social media, while 12% do through paid services.
A table shows how bloggers are driving traffic to their content.
| How bloggers are driving traffic to their content | Share of Respondents |
| Through Social Media | 90% |
| Through Search Engine Optimization | 66% |
| Through Email Marketing | 66% |
| Through Paid Services | 12% |
| Through Influencer Collaboration/Outreach | 8% |
Source: Orbit Media.
Travel Blogging Statistics
Nowadays, Travel blogs are gaining popularity. Every traveler searches for the destination before visiting it.
Here I have gathered all the important statistics about travel blogging.
- 59% of travel bloggers run more than one travel blog.
- More than 80% of travel planning starts with the Internet. And this trend is growing day by day.
- 33% of travelers use travel blogs for traveling in the United States.
- Most travel blogs are 1 to 4 years old.
- 94% of all travel blogs sell ads.
Source: Optionmonster.
Blogging Platforms Statistics
There are many blogging platforms, but WordPress maintains its dominance in blogging platforms, with more than 63% of the market share.
In this section, we will see all the important blogging platforms and their statistics.
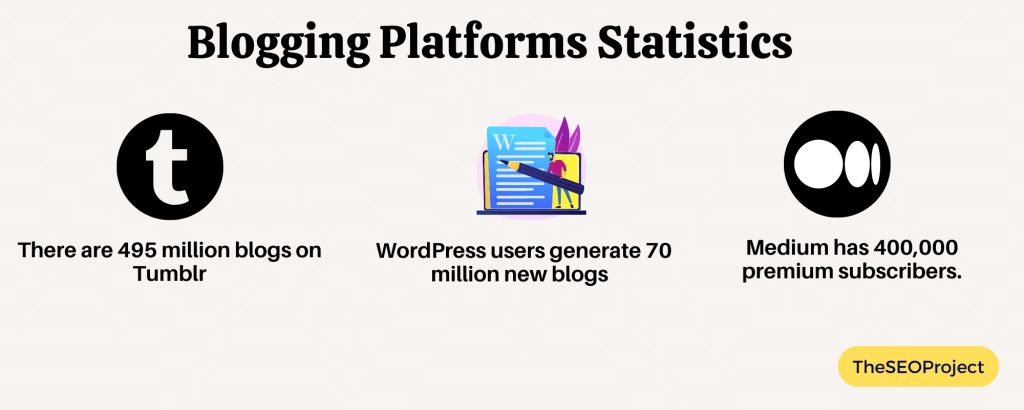
- WordPress users generate 70 million new blogs and 77 million new monthly comments.
- 71% of blogs on WordPress are written in English.
- The market share of the WordPress platform is 63.7% among all blogging platforms.
A table shows the market share of top blogging platforms.
| Blogging Platform | Market Share |
| WordPress | 63.7% |
| Shopify | 5.7% |
| Wix | 3.6% |
| Squarespace | 3% |
| Joomla | 2.7% |
| Others | 21.3% |
- The Global usage of the WordPress platform is 41.1% among all blogging platforms.
A table shows the Global usage of top blogging platforms.
| Blogging Platform | Global Usage |
| WordPress | 41.1% |
| Shopify | 3.8% |
| Wix | 2.4% |
| Squarespace | 2% |
| Joomla | 1.8% |
- WordPress gets 409 million views on wordPress.com blog pages per month.
- There are 495 million blogs on Tumblr.
- Wix has more than 180 million users and 4.2 million paying subscribers.
- Medium has 400,000 premium subscribers.
Source: Orbit Media, isitwp.com.
Blogging Income Statistics
There are many platforms where bloggers can earn money. But, still, 33% of bloggers do not earn money at all.
Here I have compiled all the top websites where you can earn money easily and many more.
- According to TechTipsWithTea, WordPress is the top blogging website to earn easily.
Here is a table showing the top 10 blogging websites to earn easily.
| Rank | Top blogging websites to earn easily |
| 1. | WordPress |
| 2. | Hubpages |
| 3. | Medium |
| 4. | Blogger |
| 5. | Ghost |
| 6. | Squarespace |
| 7. | Tumblr |
| 8. | Weebly |
| 9. | Wix |
| 10. | LiveJournal |
- 23% of bloggers generate income from Ad/Media networks, while 19% generate from Affiliated Marketing.
A table shows that from where bloggers are generating income.
| Income Source of Bloggers | Share of Respondents |
| Ad/Media Networks | 23% |
| Services | 19% |
| Affiliated Marketing | 19% |
| Physical Products | 15% |
| E-books | 13% |
| Courses | 11% |
| Other | 1% |
- HuffPost is the top blogger by its revenue. HuffPost generates 500 million in revenue yearly.
A table shows the top bloggers by their revenue.
| Top Bloggers | Revenue |
| HuffPost | 500 million |
| Engadget | 47.5 million |
| Moz | 44.9 million |
| Perez Hilton | 41.3 million |
| Copyblogger | 33.1 million |
| Mashable | 30 million |
| TechCrunch | 22.5 million |
| Envato Tuts+ | 10 million |
| Smashing Magazine | 5.2 million |
| Gizmodo | 4.8 million |
- The average income of a blogger is $51,120 annually in the United States.
- The average monthly salary of the blogger is $8,000.
- 65% of bloggers make money from freelancing.
- 33% of bloggers do not earn money at all.
- Bloggers who earn more than $50k per year create a non-live video the most.
A table shows the percentage of bloggers who earn more than $50K per year by video type.
| Video-type | Bloggers earning over $50K | Lower-income bloggers |
| Non-live Video | 42% | 10% |
| Paid Promotion | 31% | 3% |
| Live Video | 26% | 5% |
| Collaboration/Partnership | 19% | 4% |
| Manage a Community Forum or Social Media Groups | 13% | 3% |
| Sell an Online Course | 12% | 4% |
| Provide a Free Tool | 8% | 1% |
| Podcasting | 5% | 1% |
- The most profitable niche is Food Blog Niche. They have the highest median monthly income of $9,169.
Source: TechTipsWithTea, Orbit Media, isitwp.com, Ahref.
Business Blog Statistics
Blogging is essential for any business to promote its brand, reach an audience, increase sales, etc.
In this section, we will see all the important statistics about business blogs.
- 53% of marketers say blogging is their top content marketing strategy to promote their business.
- 94% of B2C marketers used social media content in the last 12 months.
A table shows the content type B2C marketers used in the last 12 months.
| Content-Type | Share of Respondents |
| Social Media Content (e.g., Tweets, Stories) | 94% |
| Blog Post/ Short Articles | 80% |
| Email Newsletters | 74% |
| Videos (Excluding Live Streaming) | 66% |
| Infographics/Charts/Images/Dada Viz | 54% |
| IOn-Person Event (Live Events, Conferences) | 50% |
- 24.17% of bloggers started blogs as an outlet for creative expression, while 16.02% started to become self-employed.
A table shows why bloggers started blogging.
| Reason To Start Blogging | Share of Respondents |
| An Outlet For Creative Expression | 24.17% |
| Become Self-Employed | 16.02% |
| Build An Audience | 12.33% |
| Teach What I Know | 12.43% |
| Earn More Money | 12.23% |
| Build A Company | 7.38% |
| Serve A Particular Audience | 5.34% |
| It Was A Calling | 3.59% |
| Other | 6.5% |
Source: Demandsage, Ahref.
Bloggers Challenge Statistics
Before starting any blog, you should know about bloggers’ challenges.
Here I have compiled all the challenges that bloggers face. These statistics can help you to overcome these challenges in the future.
- 52% of bloggers said finding time to create and promote content is their biggest challenge in Blogging.
A table shows the top challenges of Blogging.
| Top challenges of Blogging | Share of Respondents |
| Finding time to create and promote content | 52% |
| Getting traffic and attracting visitors | 46% |
| Creating quality content consistently | 39% |
| Creating enough content consistently | 33% |
| Coming up with the relevant topic | 22% |
| Getting support from within the organization | 13% |
- 27% of internet users used ad-blocking software in the United States in 2021.
A table shows the Ad-blocking user penetration rate in the United States from 2014 to 2021.
| Year | Use of Ad-blocking software |
| 2014 | 15.7% |
| 2015 | 20.6% |
| 2016 | 21.5% |
| 2017 | 23.6% |
| 2018 | 24.9% |
| 2019 | 25.8% |
| 2020 | 26.4% |
| 2021 | 27% |
Source: Ahref.
Top Blog Websites Statistics
There are more than 600 million blogs on the internet. But very few get millions of monthly search traffic.
In this section, we will see the statistics of the top 20 blog websites.
- nerdwallet.com is the leading blogging site according to its monthly search traffic. Its monthly search traffic is 79.2 million.
A table shows the top 20 blogging websites by monthly search traffic.
| Top Blogging Websites | Monthly Search Traffic |
| techradar.com | 46.5 million |
| cnet.com | 29.5 million |
| digitaltrends.com | 20.1 million |
| huffpost.com | 13.4 million |
| tomsguide.com | 13.9 million |
| nerdwallet.com | 79.2 million |
| howtogeek.com | 13.3 million |
| pcmag.com | 21.1 million |
| techcrunch.com | 7.4 million |
| consumerreports.com | 14.6 million |
| mashable.com | 5.8 million |
| thenextweb.com | 2.9 million |
| nymag.com | 5.2 million |
| tmz.com | 5.4 million |
| thewirecutter.com | 6.1 million |
| lifehacker.com | 4 million |
| t3.com | 2.8 million |
| engadget.com | 2.4 million |
| zdnet.com | 4.9 million |
| gizmodo.com | 0.8 million |
Source: Firstsiteguide.com.
Conclusion: Blogging Statistics
Whatever your blog is about, your good quality content is essential to attract traffic, audience, and sales success.
With good content, you need to understand a few more things about blogs, such as the timing of posting a blog, the length of the blog, the frequency of posting, etc. These small things can give you substantial results.
I hope this compilation of blogging statistics taught you something new and interesting. Use these statistics to start your blog and achieve success.
FAQs- Blogging Statistics
On average, 3 out of 10 bloggers report success, while 38% exceed the benchmark of success.
The world of blogs is still blooming, and many businesses use blog strategies to boost their sales. That’s why we can say blogs are still relevant in 2025 as ever.
Timothy Sykes is the richest blogger in the world. He earns $1 million per month.
The blog word count changes according to your topic and audience. But the ideal blog word count is between 1,500 to 2,000 words. These blog length also changes year by year.
There are five ways bloggers make money. These five ways are as follows:
1. From ads
2. From affiliated marketing
3. Sponsored Post
4. Sponsored Products
5. Sponsored services


